What is going on?
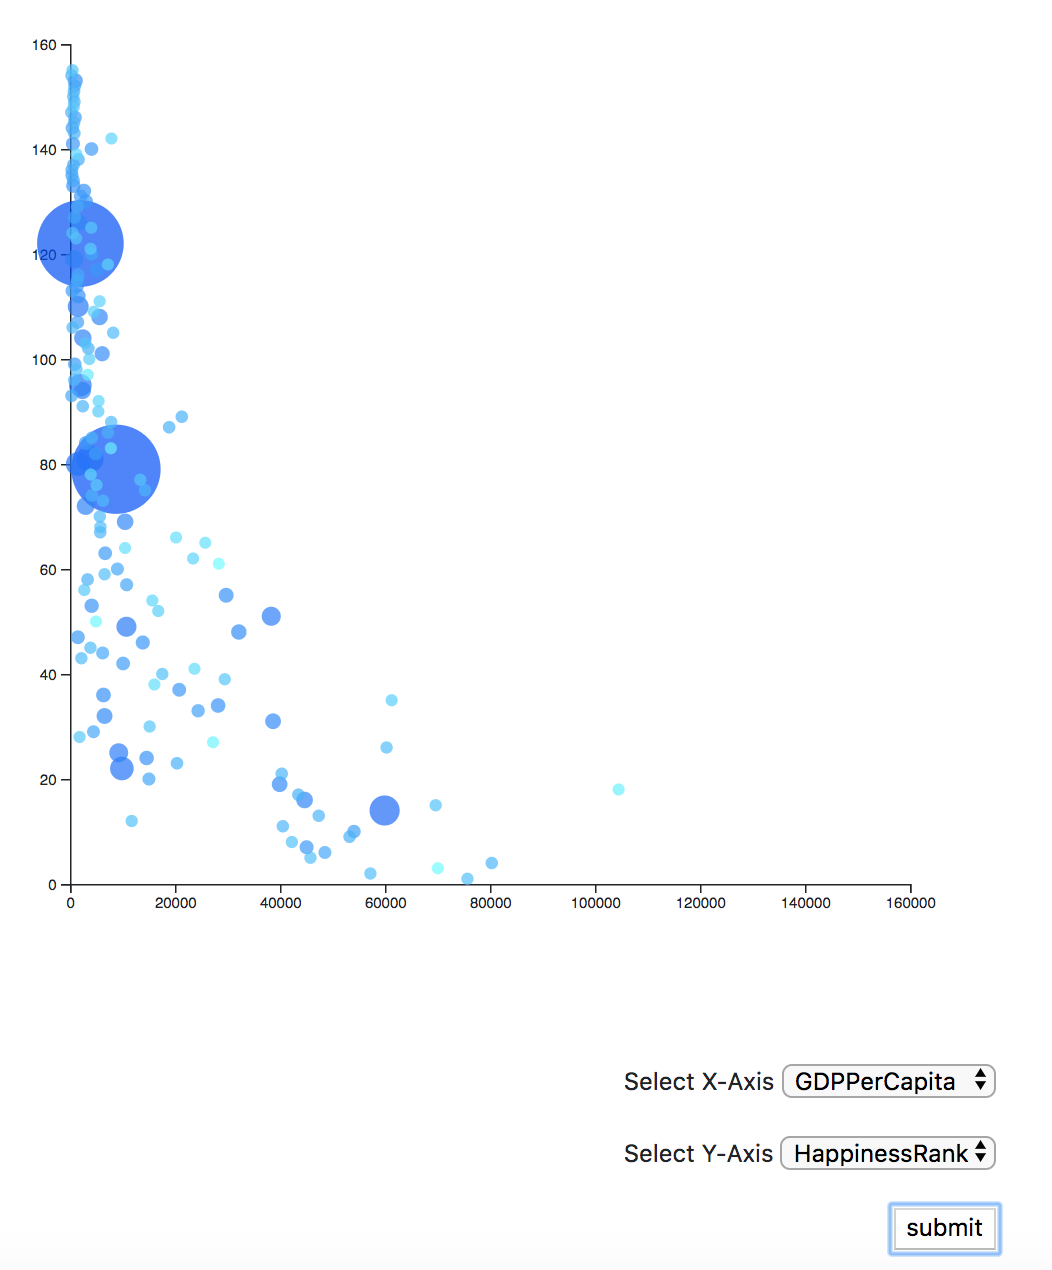
- GDP Per Capita versus Happiness We can see in the screenshot that there is a general trend that higher GDP Per Capita is positive correlated with happiness scores. A similar trend is found in the GDP Per Capita vs. happiness rank relationship. We can see that a higher GDP Per Capita is associated with a lower rank of happiness (please note: lowest rank 1 is the best). It is also interesting to note that the relationship has decreased marginal returns, meaning that after a certain point, an increase in GDP has little effect on the change of rank or score.
...
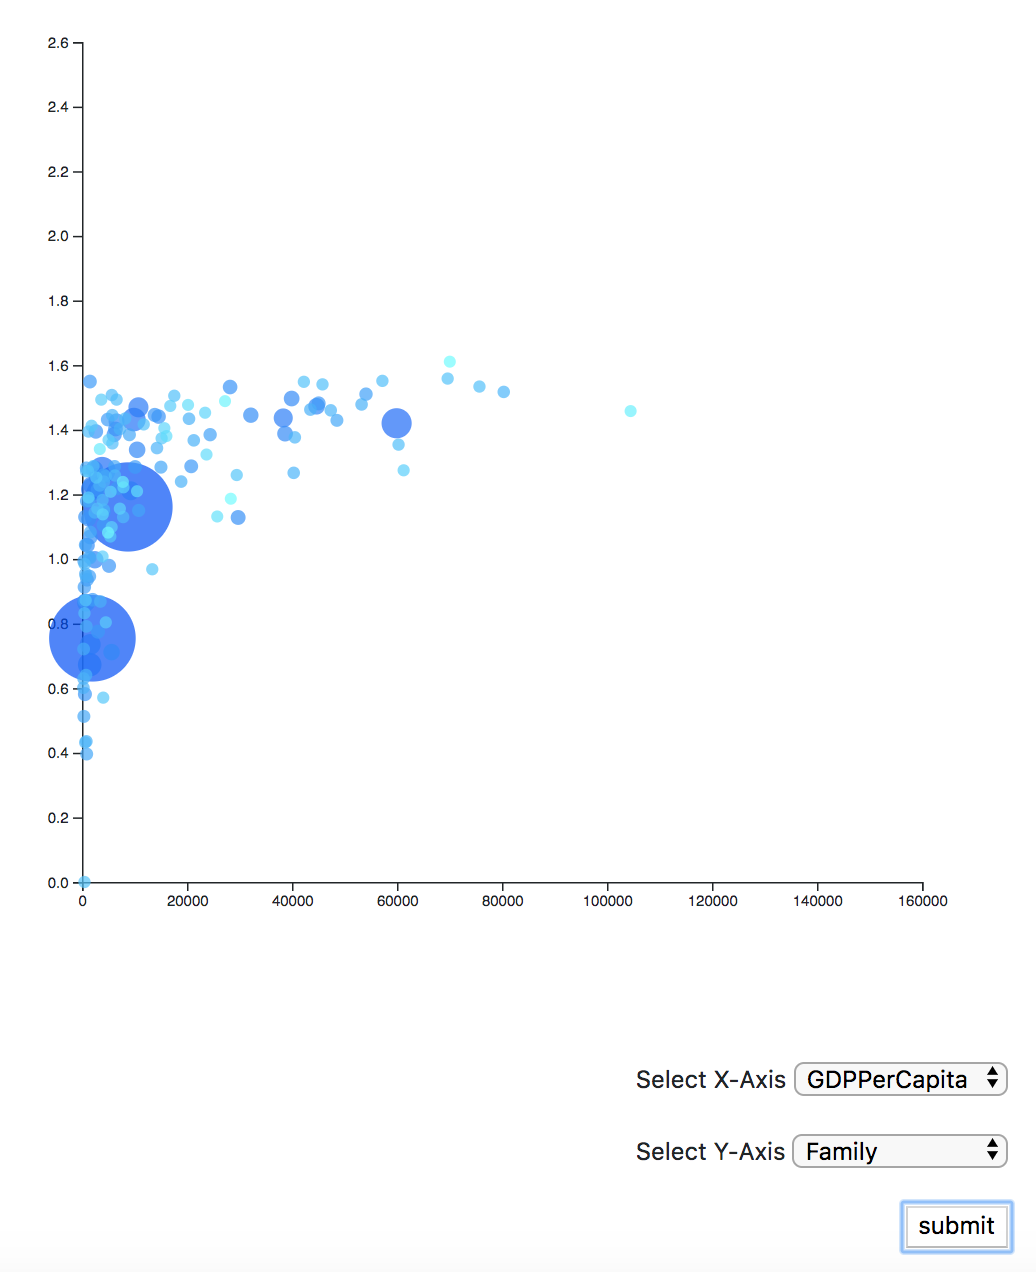
- GDP Per Capita versus Family-Friendly There is a general trend that a higher GDP Per Capita is associated with a higher family-friendly score. Likewise the previous example, the effect flattens out as GDP Per Capita gets bigger, which means that when GDP Per Capita gets to around $20000, an increase in GDP Per Capita will not have a significant association with increase in the family-friendly score.
...
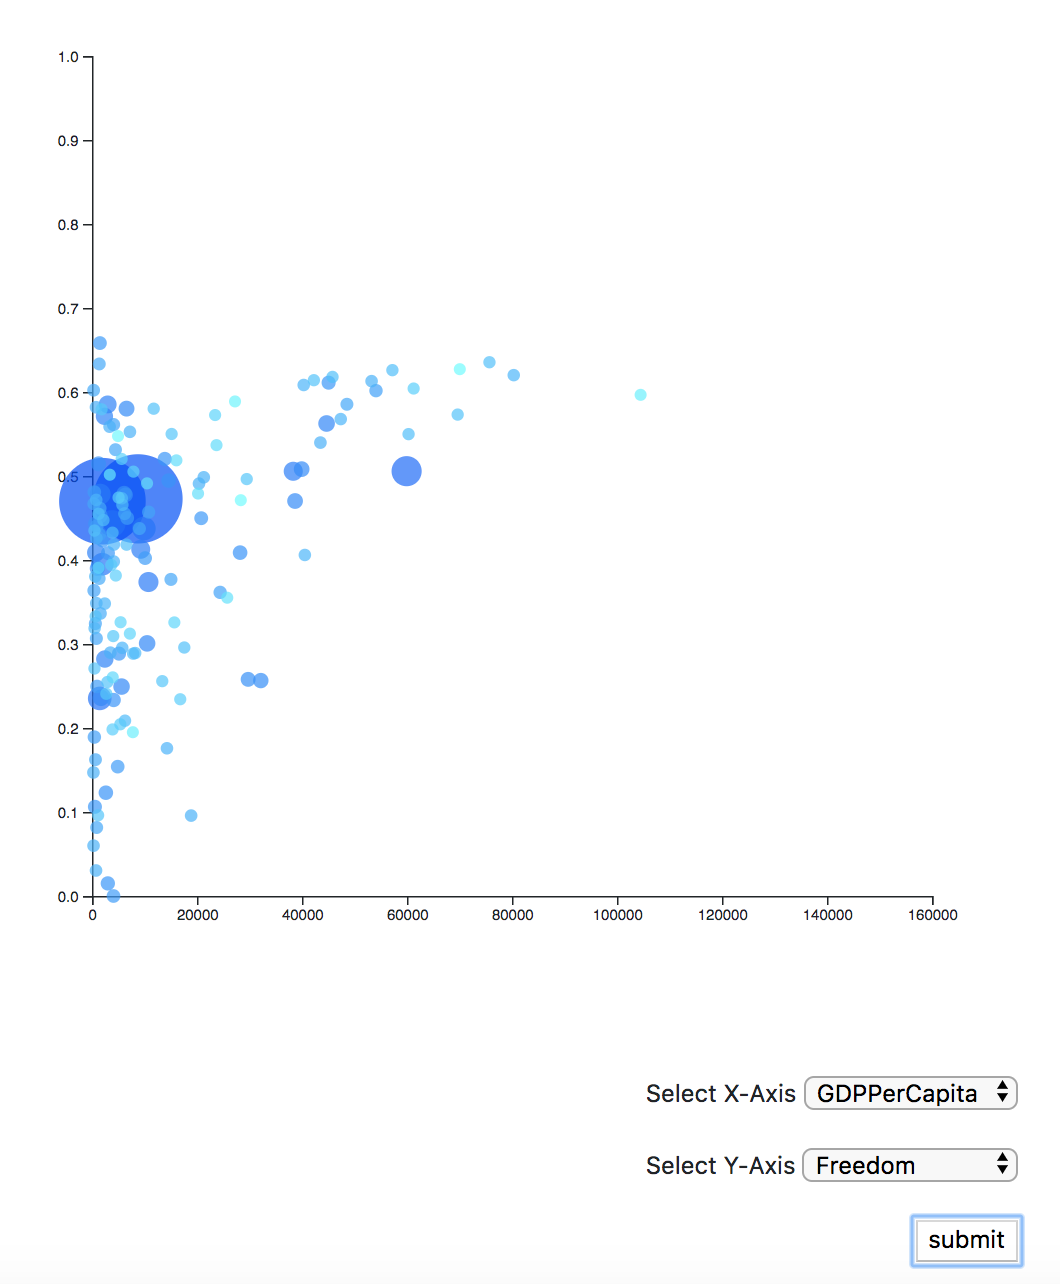
- GDP Per Capita versus Freedom There is also a general trend that a higher GDP Per Capita is associated with a higher freedom score (have more freedom). However, the association is not strong. We can see that there are a lot of countries within the $0 - $10000 GDP Per Capita range and their freedom score varies a lot from 0 to around 0.65. This means that for some countries, although the country has a low GDP Per Capita, the people living in it believe that they have a lot of freedom. Oppositely, there are countries with high GDP Per Capita which have low scores for freedom.
...
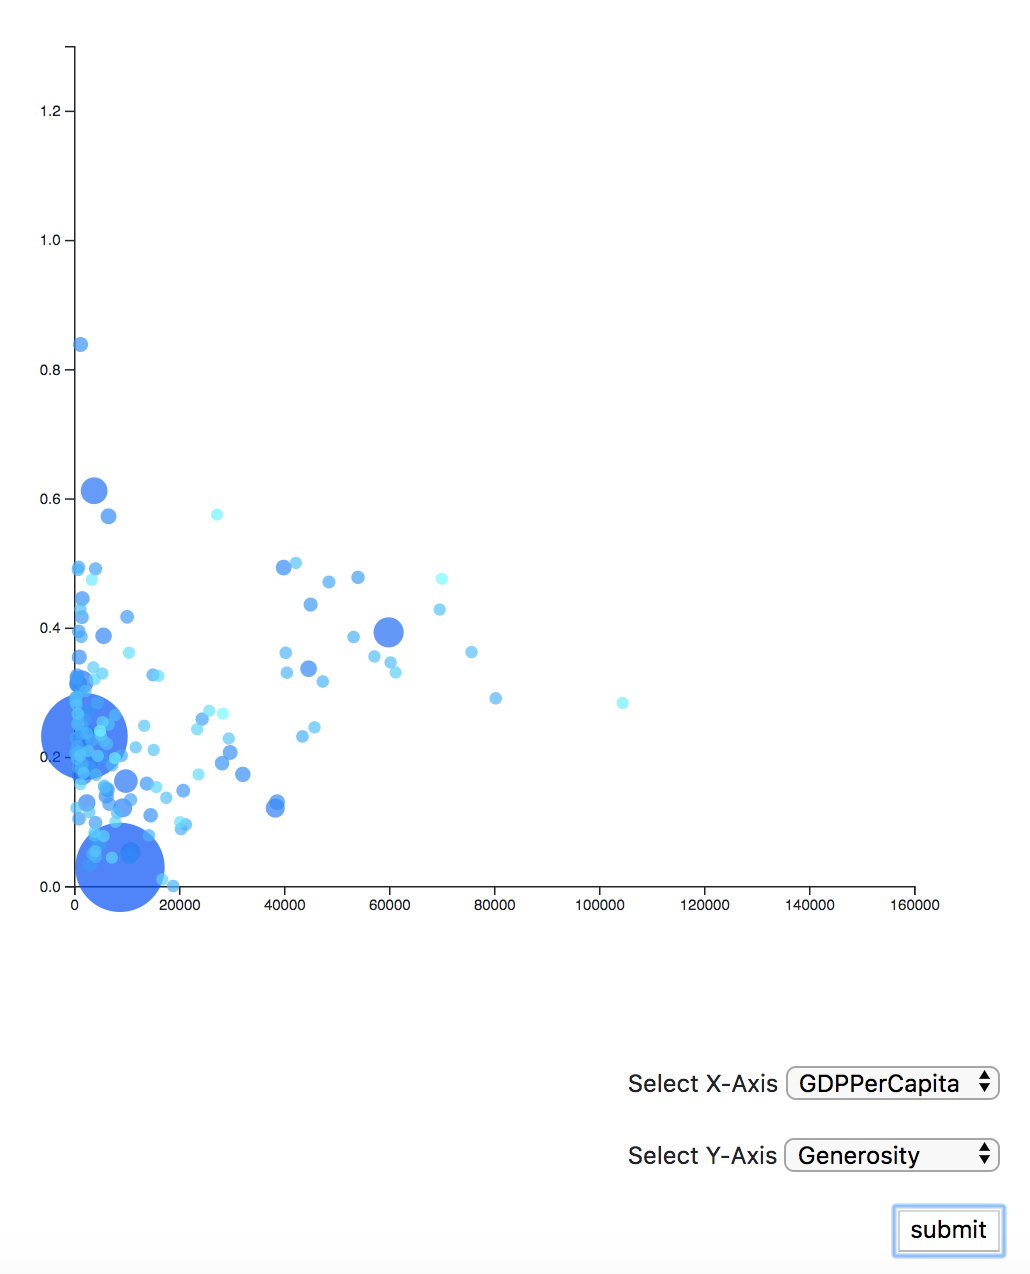
- GDP Per Capita versus Generosity [Circle] mark encodes [capital for each country]. For countries with GDP Per Capita between $0 and $10000, we can see that a lot of them have generosity score around 0.3, while there are outliers like Indonesia that have a higher score of generosity compared to all of the countries that have a higher GDP Per Capita. For countries with GDP Per Capita higher than $10000, there is a little bit of the trend that higher GDP Per Capita may lead to a higher generosity score. However, the relationship is very weak. So, we do not see a strong correlation between income and generosity. Thus, having more money doesn’t mean that people will be more generous.
...
- Population Size [Circle] mark encodes [capital for each country]. As previously mentioned, in the scatterplot, the bubbles' area correspond to a country's population size. It is interesting to note that there does not seem to be any strong relationship of population size and GDP, happiness, family, freedom or generosity.