Good Visualizations:
Table Setting

Marks:

[Rectangles] mark encodes [the amount of money].

Visual channels:

[position-y] channel encodes [the rank of the amount of money].

[color] channel encodes [the amount of money (the darker, the larger the amount)].

Who is the audience? The audiences for this visualization are people who read articles from Bloomberg, NYtimes, The Guardian, Washington Post, or World Bank. They may be interested in numbers behind the business world and market value behind companies like Apple. Also, the audiences may also be people who are passionate about social issues like income disparities and resource disparity between the 99% of people in the world and the top 1%.

Message and questions behind this visualization: The primary goal of this visualization is to give comprehensible meanings to big numbers, like 1 trillion. For example, it uses Apple’s market value to represent 1 trillion and 13 trillion to represent the US’s household debt. It uses the size of the squares to compare the different aspects, for example, the world GDP has a much bigger square than Apple’s market value, proportional to their actual sizes 1 trillion vs. 75.6 trillion. The secondary goal of this visualization is to emphasize the wealth discrepancies between the 99% of people in the world and the top 1%. As shown in the graph, the wealth of the top 1% is on the lower right corner, which means the top 1% has more money than the money in all the world’s central banks, the world GDP, and even the total global debt. This visualization emphasizes the huge problem of income inequality in the world and raises awareness for this issue.

What data is encoded in the visualization? Information on market value, GDP, debt, and wealth, and their corresponding values in trillions.

How does the visualization encode the data? The visualization encodes the data in the Trillion Dollar-o-Gram, which utilizes the sizes of squares to compare the values.

What tasks do readers perform on the visualization? Readers are able to compare values, gain an understanding of the relations between different aspects, and also identify the extreme (wealth of top 1%).

How are the five principles applied to this visualization? Truthful: The visualization is truthful since it showed the data in context using the sizes of the squares and disclosed the data source. Functional: The visualization was very easy to read, used accurate sizes of squares to represent numbers, and it supports the meaningful task: to provide context for large numbers. Beautiful: The font and color progression adopts minimalist design principles and is very easy to read. Also, it is free of unnecessary elements. Insightful: The visualization helped to confirm my belief in the wealth discrepancy in our society, but it revealed to me that the discrepancy is much larger than I thought. Enlightening: The visualization went beyond the numbers and insights. It raised awareness of socio-economic issues that exist in our society.

Why is this visualization good? As we talked about in class, context is very important when we want to represent data. This visualization provides the context for readers to understand what 1 trillion really means and how it compares to other important concepts like world GDP and wealth of the top 1%. It also raised awareness for the income and wealth gap between the 99% and top 1%.


Who is the audience? The main audience for this visualization is people working in the tech field or are interested in going into the tech field.

Message and questions behind this visualization: The visualization shows the gender and ethnic gap within the tech field. It shows the different groups of people working in major tech companies in the US and compares the numbers with the US population.

What data is encoded in the visualization? US population, the number of people (different groups: gender, ethnicity) working in the major tech companies in the US.

How does the visualization encode the data? It uses the horizontal bar chart.

What tasks do readers perform on the visualization? Readers are able to compare the population of different groups of people within a tech company with the US population. They can see that there are more male than female working in all of the major tech companies, and there is a higher percentage of Asians working in major tech companies compare to other ethnicities. It also allows readers to interact with the visualization by clicking on a column and the graph will be sorted according to that column.

How are the five principles applied to this visualization? Truthful: The visualization provides a context for the data. By comparing each number to the US population, it is very easy for readers to understand which group of people is well represented in the tech field. It also disclosed the data source. Functional: The visualization was very easy to read and clear. It not only uses the lengths of squares to represent the number of people but also included the actual number (in proportion) to make it easier for readers to compare. Beautiful: the color scheme of this visualization is very clean and beautiful with no “junks.” Also, it uses grey/black for the data for the US population, US congress, and so on, in order to emphasize the actual companies’ data in the middle. Insightful: The visualization is insightful because it gave meaning to the numbers by comparing them with the US population in general. It showed which companies are more diverse. On the other hand, I would like to learn more about the details in each ethnicity, for example, within Asians, what percent is Chinese American vs. Indo-American, which the graph did not show. Enlightening: The visualization showed interesting patterns about diversity in the tech field in the US, and it showed that some are better represented than others. By including data from previous years, the visualization is able to let the readers see the changes in minority representation in the tech field. On the other hand, it also can be misleading if readers interpret it incorrectly. For example, if all the increase in the Asian population went to Indo-Americans, we cannot say that the company was becoming more diverse. Thus, I believe the visualization can be better if it also represents the subgroups within each ethnicity.

Why is this visualization good? Although it has areas of improvement, I still believe this is a good visualization because it not only provides a great context for the data, but also is able to interact with users to rank according to different criteria (e.g. female, white)and track the changes across years. It provides insights into the gap between genders and different ethnicities that exist in the tech field.
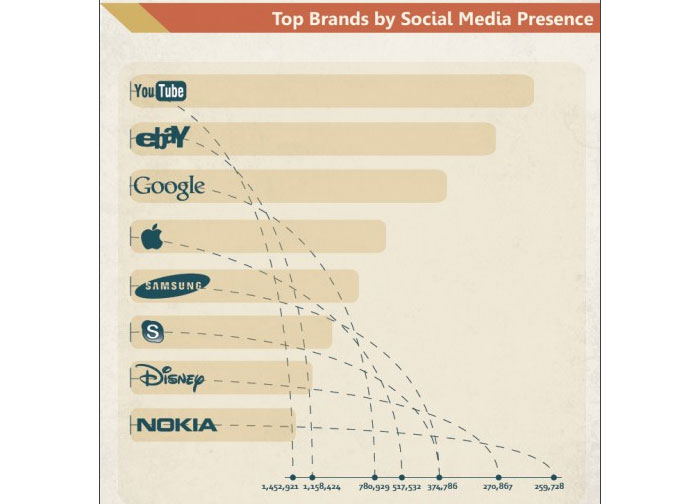
Table Setting

Marks:

[Rectangles/bars] mark encodes [the number of people].

Visual channels:

[position-x] channel encodes [characteristics].

[position-y] channel encodes [companies].

[color] channel encodes [the number of people in each characteristics].


Table Setting

Marks:

[Areas] mark encodes [the amount of people consider a language as mother tongue].

Visual channels:

[values] channel encodes [the amount of people].

[color] channel encodes [languages].

Who is the audience? People who are interested in the topic of languages or are interested in learning different languages.

Message and questions behind this visualization: This visualization aims to provide the readers with a better understanding of the size of the 23 languages that are considered as mother tongue in the world. Also, it listed dialects within each language, the number of countries in which a language is spoken, and the most popular languages being learned in the world.

What data is encoded in the visualization? The number of languages that are considered mother tongue in the world. The number of people who consider a language as their mother tongue. The number of countries in which a language is spoken. The most popular languages being learned in the world. The count of the living languages used as the first language in 60 countries.

How does the visualization encode the data? The visualization utilizes the Voronoi Treemap to visualise hierarchical data and to show the weight of each one.

What tasks do readers perform on the visualization? The readers can learn about the 23 mother tongue languages that are currently being spoken in different countries. They can also learn about the dialects within each language. More importantly, they can compare the size of each area and see which languages are used as the mother tongue by more people.

How are the five principles applied to this visualization? Truthful: the visualization provided the data source and showed data in the context with the size of each area. Functional: the graph is very easy to read encodes the population for each language effectively with the sizes. Beautiful: the most important quality of this visualization is its beauty. The color scheme is well balanced and the fonts are also well-designed. Insightful: the visualization works the best when combined with the bar chart at the bottom. It showed the insight that although English is not the most-spoken first language, it is the language that is spoken in most countries. Enlightening: This visualization is able to inform the readers about the languages in different parts of the world. It also makes us feel connected and appreciated the diversity in the world.

Why is this visualization good? I believe this visualization is good because it presented the data in the full picture, by multiple visualization formats: bar graphs, the big cycle, and map. It was able to show different sides of the data, for example, the most popular languages, the number of countries a language was spoken, or the distribution of living languages. It gives readers a sense of union and appreciation for all the unique languages and cultures in the world.

Bad Visualizations:
Table Setting

Marks:

[Areas] mark encodes [each kind of candy and their flavors].

Visual channels:

[Ring shape] channel encodes [flavors].

[color] channel encodes [flavors - specifically comparisons like “chocolate vs. non chocolate”].

[color] channel also encodes [candy score - in percentile].

Who is the audience? Candy manufacturers who want to learn about people’s preferences for Halloween candies.

Message and questions behind this visualization: This visualization shows that the chocolate-peanut butter combinations are the most popular.

What data is encoded in the visualization? The flavors, and the scores for each candy (mark the preference).

How does the visualization encode the data? It encodes the data in a sunburst diagram.

What tasks do readers perform on the visualization? The readers can see the different combinations of flavors for each candy and identify which candies are more popular.

How are the five principles applied to this visualization? Truthful: It is truthful since it disclosed the data source: “FiveThirtyEight's Halloween candy ranking story.” Functional: There are many factors in the graph (different flavor combinations), and it is difficult to read with all the levels and colors. For example, candy score color is similar to the color used for attributes like “nutty/non-nutty” or “crispy/non-crispy.” So it is very hard for the readers to distinguish the colors and to understand what they represent. Beautiful: The visualization is beautiful with all the well balances colors, but unfortunately, since there are too many colors, it becomes difficult to decode the graph. Insightful: The graph is insightful for candy manufacturers since now they know which kind of candies are more popular. Enlightening: I don’t see much about the value of this graph other than it provides insights for the candy manufacturers and it is interesting to know which kinds of candies are more popular. It doesn’t inform us more about our society or tell us stories behind the data. So I don’t think this is enlightening.

Why is this visualization bad? The visualization looks pretty at first glance, but the way it encodes data using similar colors makes decoding the graph very difficult. Also, the way it provides information is inconsistent as it writes out some of the names of the most popular candies but also ignores others. Last but not least, the topic behind the visualization is not very meaningful or important, so the visualization doesn’t provide much value.

Table Setting

Marks:

[Areas] mark encodes [each kind of candy and their flavors].

Visual channels:

[different shape] channel encodes [flavors].

[color] channel also encodes [candy score - in percentile].

I think this is my best redesign because it solves the main problem in the original visualization - hard for the readers to distinguish the colors and to understand whether they represent candy score or characteristics of candy. So, by using shapes to represent the characteristics of candies, we now only use color to encode candy score, which makes the visualization easier to read.

Table Setting

Marks:

[point] mark encodes [candy].

Visual channels:

[position-x] channel encodes [different characteristic of candy flavor].

[position-y] channel encodes [characteristic comparison, e.g. “chocolate vs. non chocolate”].

[color] channel also encodes [candy score - in percentile].

This visualization clearly shows which flavors are more popular. For example, we can see that there are more green dots close to chocolate and more purpose dots close to non chocolate, which means that people prefer the chocolate flavored candies. With this visualization, we can see that chocolate, nutty, and crispy are the most popular flavors in candy. Thus, this visualization provided the same information for candy manufacturers but it is much easier to read than the original visualization.

Table Setting

Marks:

[rectangle] mark encodes [candy matched to a flavor].

Visual channels:

[position-x] channel encodes [candy].

[position-y] channel encodes [flavor].

[color] channel also encodes [candy score - in percentile].

This visualization flattens out the original visualization (I didn’t draw out the whole picture because there are too many candy types). It shows some interesting pattern: higher ranking candies have chocolate flavor. If the whole graph is drawn out, we can clearly see the patterns for all the higher and lower ranking candies and what flavors they have. However, I realized that a problem with this visualization is that since there are so many different kinds of candies, the graph will be very long horizontally if it includes all the candies.


Table Setting

Marks:

[Rectangles] mark encodes [social media presence].

Visual channels:

[position-x] channel encodes [amount of followers].

[position-y] channel encodes [companies].

[dotted line] channel encodes [the link between the company and its number of followers].

Who is the audience? People who are interested in the brands shown in the graph.

Message and questions behind this visualization: This visualization aims to show the top brands by social media presence.

What data is encoded in the visualization? The number of subscribers.

How does the visualization encode the data? It uses a bar graph and dotted lines to link the brands to the amount of subscribers.

What tasks do readers perform on the visualization? Readers try to follow the dotted lines to find the number of subscribers for each brand.

How are the five principles applied to this visualization? Truthful: We cannot say whether the data tell the truth or not since the visualization didn’t provide the source of data. The graph didn’t provide the year of the data so we cannot search for or verify the data. Also, the length of bar graphs is not proportioned to the number of subscribers. Functional: The visualization was hard to follow, especially the dotted line. I had to use my fingers to follow the dotted line to find the number of subscribers for the brands. Also, for the bar graph, the starting point is on the left, but for the parabolic dotted lines, the smaller point is on the right. So the information on the graph is not consistent. Beautiful: The parabolic dotted lines intersect with each other and make the graph very hard to read and less appealing. Also, the composition of the graph is heavy on the top left side (because of the size of the bars) and light on the lower ride side. So the imbalance gives me a feeling that the graph is going to tilt, which is not good. Insightful: It didn’t provide any meaningful information other than the rank of the brands in terms of social media presence. Enlightening: The visualization didn’t show interesting patterns about the social media presence of the companies.

Why is this visualization bad? I think this is a bad visualization because it scored low on every aspect of the five principles. First, readers cannot trust the graph since they don’t know where the data comes from. Second, the visualization didn’t provide meaningful information other than showing the companies that have the most social media presence. Third, the way it shows the data is confusing because of the overlapping of the parabola dotted lines and the disproportionate bar graphs.

Table Setting

Marks:

[line] mark encodes [social media presence].

Visual channels:

[position-x] channel encodes [companies].

[position-y] channel encodes [social media presence/amount of followers].

I think this is my best redesign because it not only shows the amount of subscribers for each company clearly, but also shows the ranks of each company by using a “stair shaped” graph. It lets the readers know instantly that the goal of the graph is too see which companies have the most social media presence compares to others.

Table Setting

Marks:

[bar] mark encodes [social media presence].

Visual channels:

[position-x] channel encodes [social media presence/amount of followers].

[position-y] channel encodes [companies].

This redesign utilizes bar graph to show the amount and rank for each company in regards to their social media presence. It eliminates the useless dotted lines in the original graph to make the whole visualization easy to read.

Table Setting

Marks:

[area of circle] mark encodes [social media presence].

Visual channels:

[position-x] channel encodes [companies].

[size of circle] channel encodes [the amount of followers].

[position-y] channel encodes [the rank of companies in terms of followers].

This visualization not only presents the amount of social media followers for each company, but also ranks the social media presence. So readers can easily identify that Youtube has the most followers.


Table Setting

Marks:

[Areas] mark encodes [the percentage of baby boomers who consider themselves to have certain characteristics].

Visual channels:

[color] channel encodes [different characteristics].

[line] channel encodes [the link between the color, the characteristics, and its respective percentage].

Who is the audience? Baby boomers and people who are interested in learning about how the baby boomers consider themselves (e.g. HR professionals.)

Message and questions behind this visualization: The visualization aims to show how much percent of baby boomers consider themselves to be leaders, learners, tech-savvy, people-savvy, and creative.

What data is encoded in the visualization? The percentage of baby boomers who consider themselves to fit in each of the criteria.

How does the visualization encode the data? It uses the shape of a man and fills in each of the percentages. It uses different colors to represent different criteria.

What tasks do readers perform on the visualization? The readers can identify which characteristics the baby boomers consider themselves to have.

How are the five principles applied to this visualization? Truthful: It is not truthful because it didn’t provide the source of data. Functional: the visualization is very misleading. The colors filled the whole person-figure which gave a reader the understanding that all the percentage should add up to 100%. However, they added up to 243%. Also, the percentage didn’t match the sizes of the color, so the representations of the numbers and the height are skewed. Beautiful: overall, the graph is clean and the colors are beautiful. Insightful: It provides the insight that baby boomers consider themselves to be more people-savvy and less tech-savvy. Enlightening: the graph’s mean goal was to gain an understanding of how the baby boomers describe themselves and it didn’t provide much information on top of that.

Why is this visualization bad? I think this is a bad visualization. First, the graph and the data didn’t match since the percentage added up to 243% but the graph indicated 100%. Second, the different characteristics are not ranked, so readers have to look up and down to rank the characteristics themselves, which made the graph harder to read. Third, the person-shaped graph didn’t add value to the topic of “how baby boomers describe themselves,” rather it made reading the percentage harder since the irregular shape.

Table Setting

Marks:

[quarter circle] mark encodes [percentage].

Visual channels:

[position-x] and [position-y] channel encodes [percentage of baby boomers who consider themselves to have certain characteristics].

[size of each quarter circle] channel encodes [the amount of baby boomers in percentage, the bigger the quarter circle, the more percentage].

I think this is my best redesign because it clearly shows the percentage for each characteristic. With more people identify themselves with a certain character, the size of the quarter circle gets bigger. It is easy for us to see that the most popular characteristic is “people-savvy,” and 78% baby boomers identify with it. Also, in this way, the area doesn’t have to add up to 100% which resolve the problem in the original graph.

Table Setting

Marks:

[area] mark encodes [percentage].

Visual channels:

[position-x] channel encodes [percentage].

[position-y] channel encodes [characteristics].

[length of each bar] channel encodes [percentage of baby boomers who consider themselves to have certain characteristics].

Bar graph is useful when we want readers to easily compare the amounts by looking at the length of each bar. In this visualization, the bar graph lets readers see the percentage for each characteristics and ranks the characteristics by percentage.

Table Setting

Marks:

[line] mark encodes [percentage].

Visual channels:

[position-x] channel encodes [characteristics].

[position-y] channel encodes [percentage].

[height of each line] channel encodes [percentage of baby boomers who consider themselves to have certain characteristics].

This stair graph works similar as a bar graph, which lets readers see the percentage for each characteristics and the ranks.

Author: Duanchen Dora Liu. Web page styling derived from W3.CSS 4.13 June 2019 by Jan Egil and Borge Refsnes.